Competitiveness on the National Stage
As we enter the final, frantic months of the 2024 presidential election with the two major party candidates, former President Donald Trump and Vice President Kamala Harris, “effectively tied” according to Reuters’ analysis of a recent NY Times/Siena poll, circumstances beg the question: how competitive are American presidential elections, anyway? Put another way, if current national polls end up being a fair predictor of the vote share margin come Election Day, will this razor-tight race be out of step with historical elections?
At a first pass, the answer seems to be: not really.
Figure I plots all 18 presidential elections between 1948 and 2020 by their respective margins in the two-party popular vote. The vast majority of these elections resulted in margins of less than 10 points in either direction, with only two exceeding a 20-point differential – one in favor of a Democrat, and one in favor of a Republican. If the Harris-Trump race remains just about tied, it would fall somewhere around a 0-point margin, putting it in line with one of the two modes; not out of step with historical outcomes at all.
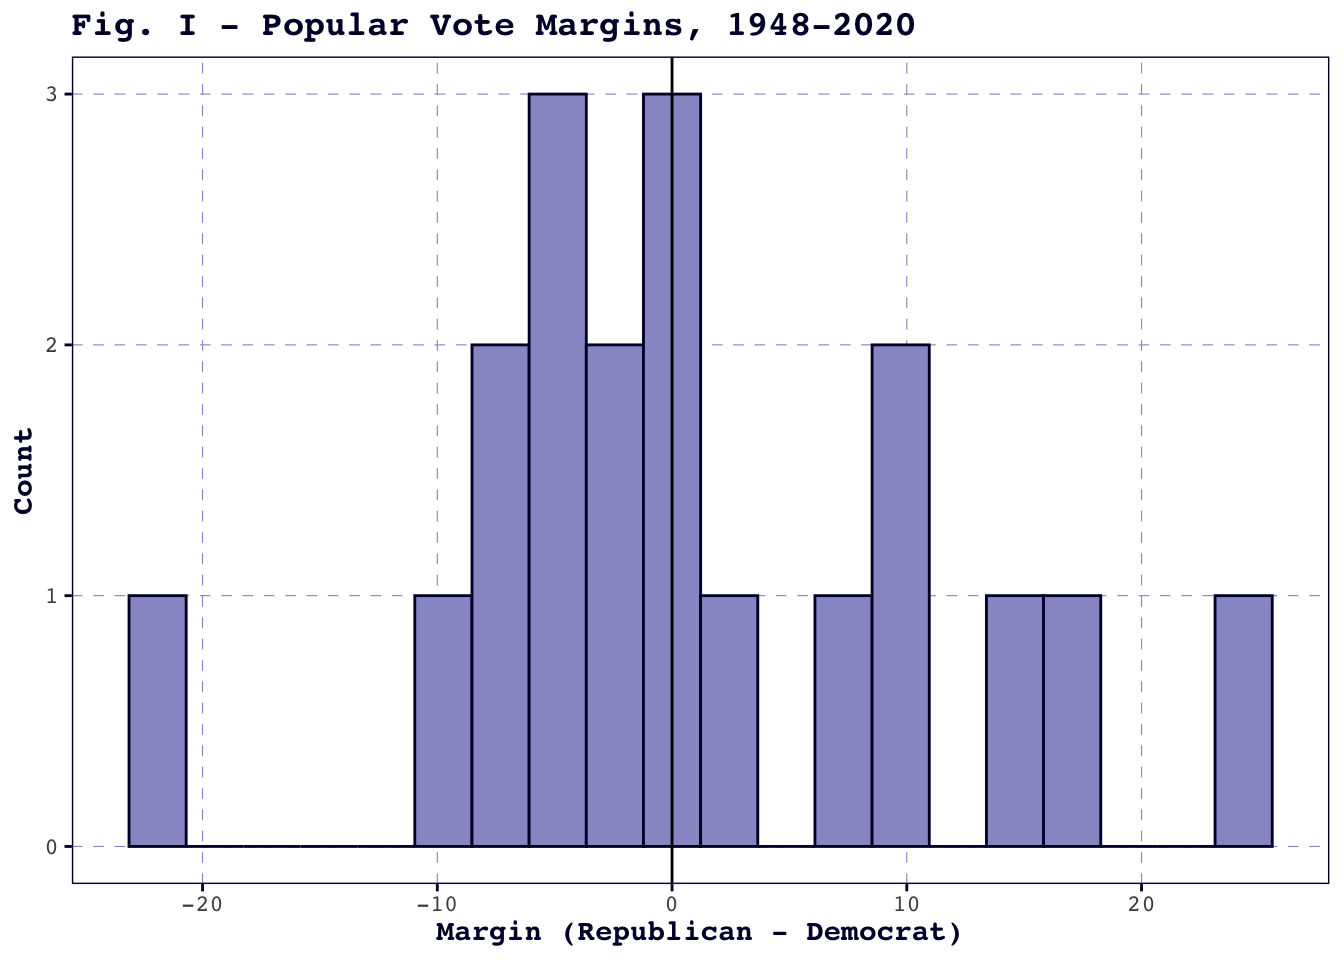
However, Figure I does not show trends over time: it could be that many of the elections clustered around 0 occurred over half a century ago, and may therefore be much less useful as points of comparison for the upcoming 2024 contest.
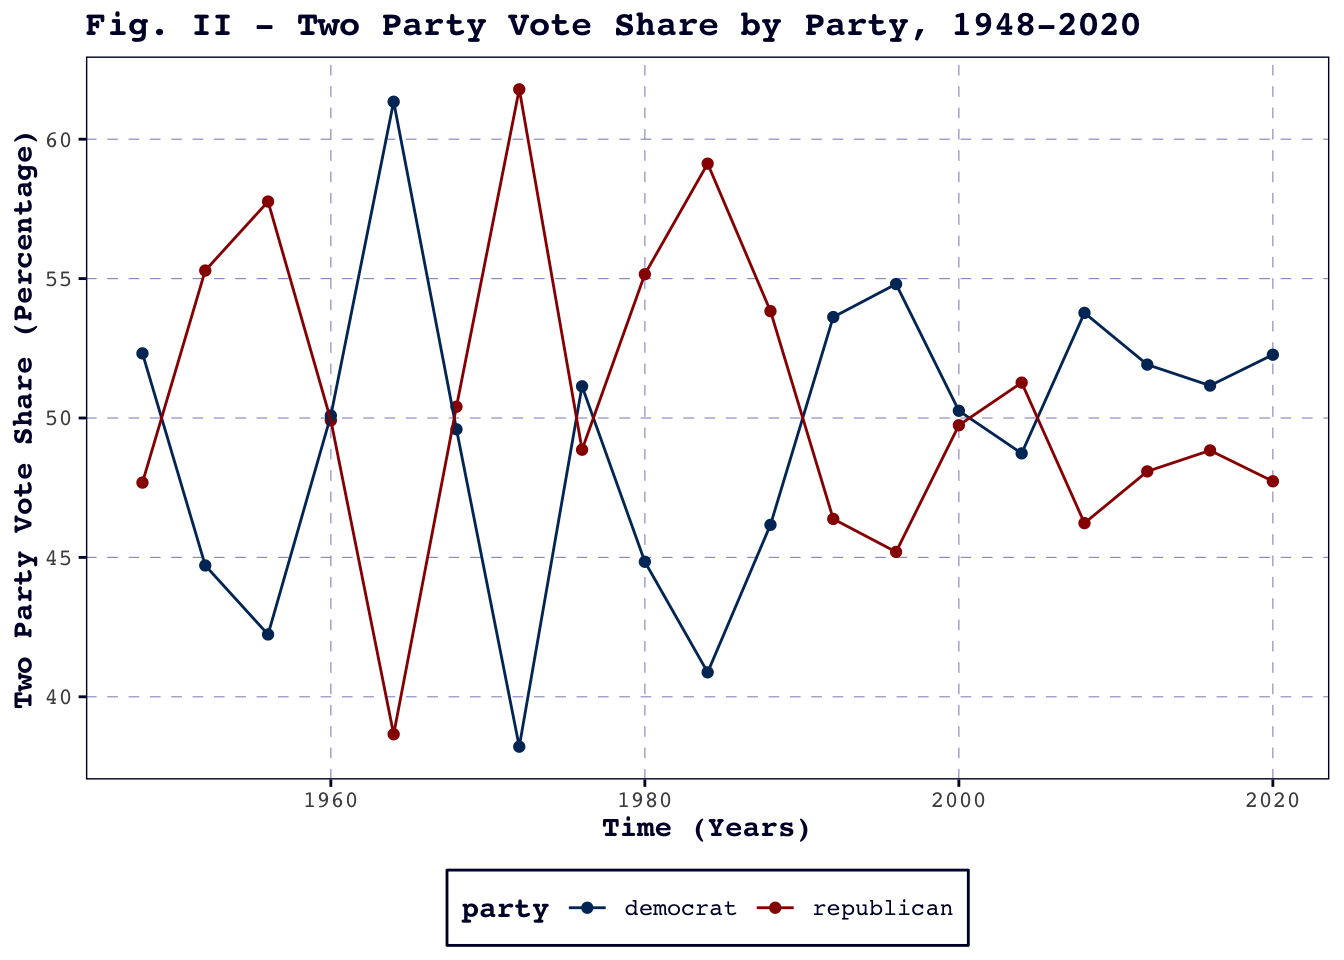
Figure II offers a clearer picture of national-level competitiveness trends. Between the 1950s and the 1980s, the graph shows a highly regular pattern where the parties trade off blowout victories about every three or four election cycles, with one highly competitive race in between. This pendulum swing begins to break down in the early 1990s – as even the highest-margin races begin contracting to 50% – and becomes virtually indistinguishable in the 21st century. Though a Republican candidate has not won the two-party popular vote since 2004, Democrats have not run away with the subsequent elections either, with both parties’ vote shares hovering between 45-55%.
Figure II confirms that, were the 2024 race to result in even tighter margins than the last four presidential elections, this would be consistent with the latest trends; for some time, neither party seems to have had the momentum which characterized the blowout victories of the ‘60s and ‘70s.
What these graphs fail to illustrate is why blowouts seem to have become less common in recent elections. One possible explanation concerns “affective polarization” – that is, the tendency of partisans to express distaste for members of the opposing party – which Iyengar et al. note has grown even where this animosity does not correspond with more divergent policy positions between Republicans and Democrats. It could be, then, that the underlying mechanism, whereby voters become predictably dissatisfied with the party in power, is still at work, but that intraparty dissatisfaction cannot, in many cases, override partisans’ increased hostility to the opposing party.
Competitiveness in the States
Of course, the national popular vote is only one part of the equation – we should also consider trends in state-level voting over time.
To this end, Figure III provides a bird’s eye view of states’ voting records between 1948-2020 by compressing all 18 races into their state-level two-party vote share margin. The map places these margins on a continuous scale, where deep red represents an average margin in favor of Republicans, deep blue represents an average margin in favor of Democrats, and white is an average margin of 0.
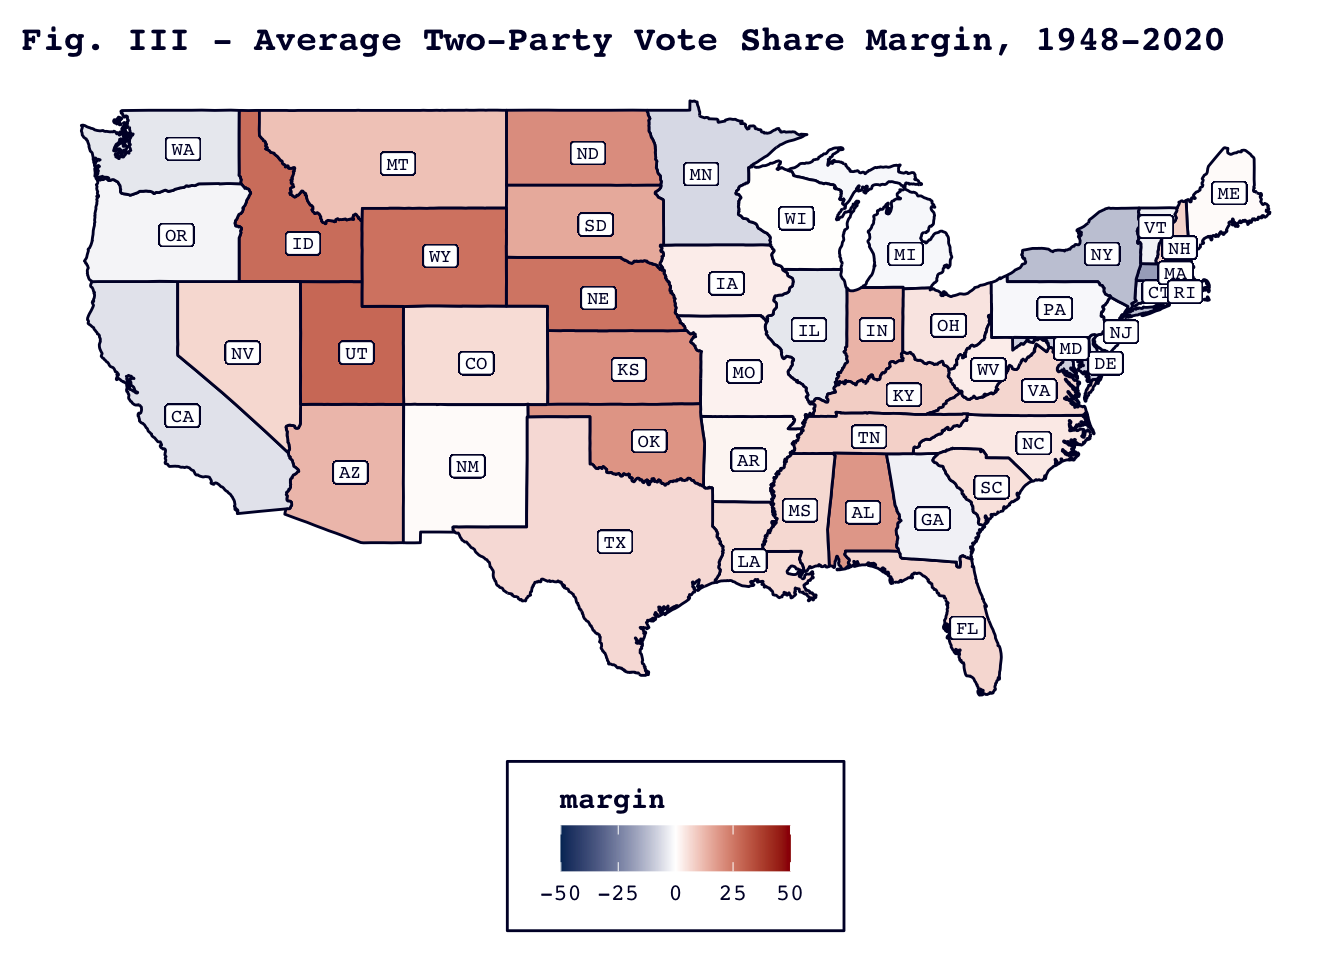
Since our interest lies with the 2024 election, we should now ask: how well does this map reflect the electoral realities Trump and Harris are currently facing?
On the one hand, Figure III correctly identifies Wyoming, Idaho, and Utah as deep red states – this is true on average in the dataset, and, according to FiveThirtyEight, which classifies all three as “solid Republican,” remains true now. Additionally, some states, like Pennsylvania and Georgia, which are very light-colored on the map – meaning they have average margins close to 0 – have been identified as toss-ups by FiveThirtyEight, and may indeed experience near-zero margins in 2024.
On the other hand, these averages may be misleading.
Imagine we have two states, A and B, which both have average margins around 0 for the period 1948-2020. State A might have a history as a battleground state, frequently experiencing tight races and having no consistent, discernible party preference in the long-run. State B, on the other hand, might have had a strong preference for one party for several decades and then switched its allegiance to the other for the latter decades, resulting in high margins for each that effectively cancel each other out in the averaging process.
The difference between state A and state B is invisible in Figure III, but it is important to forecasters and campaign strategists alike: it would not make sense – and might be highly wasteful – to consider state B a “toss-up” state on the basis of its past voting patterns.
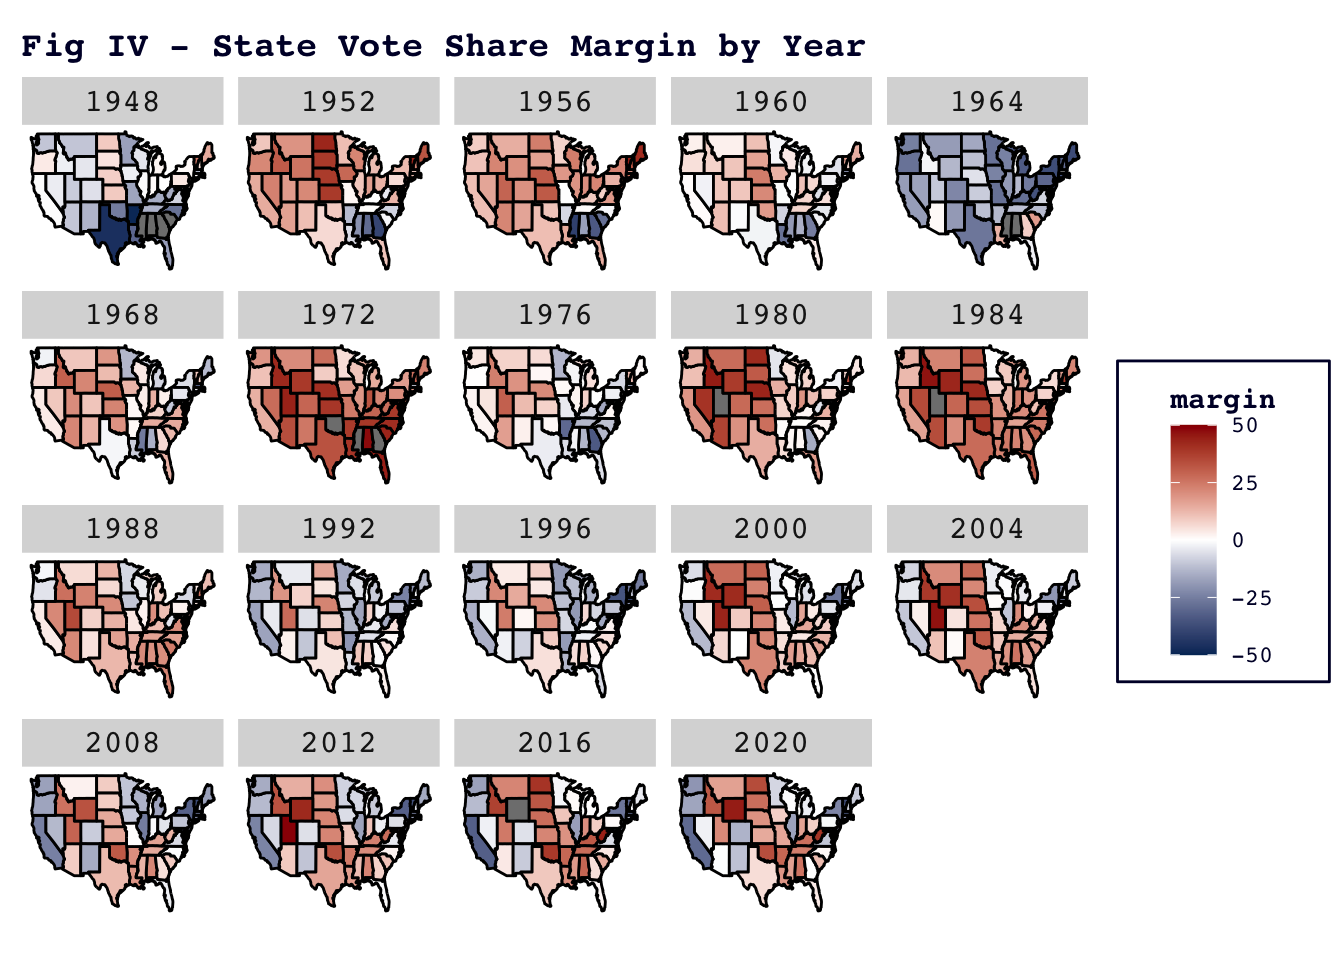
Figure IV allows us to visually tease apart state As and state Bs. If we focus, for instance, on California, we see that it experienced a macro-swing from a purple state with an occasional Republican lean at the start of the dataset, to a lean-Democratic state in the ‘90s and early aughts, and finally to a deep blue state in the last four presidential elections. California therefore seems to be more of a state A, compared to a state like Pennsylvania which has experienced more micro-swings from one election to the next in the same period.
While state Bs unsurprisingly take center stage in election forecasts due to their potential decisiveness, California’s history is a reminder that even states whose party preferences we now regard as set in stone may not stay that way forever. Will the GOP continue attracting voters without college degrees at higher rates? Will Democrats lose support among Black and Hispanic voters? Subtle shifts like these take time, but they nevertheless continue to slowly reconfigure the electoral map.
References
“Changing Partisan Coalitions in a Politically Divided Nation: Party identification among registered voters, 1994-2023.” (2024, April 9). Pew Research. https://www.pewresearch.org/politics/2024/04/09/changing-partisan-coalitions-in-a-politically-divided-nation/
Gram, S. (2024, September 8). “Harris, Trump effectively tied in final stretch of 2024 race, NYT/Siena Poll Shows.” Reuters. https://www.reuters.com/world/us/harris-trump-effectively-tied-final-stretch-2024-race-nytsiena-poll-shows-2024-09-08/
Iyengar et al. (2012). “Affect, Not Ideology: A Social Identity Perspective on Polarization.” Public Opinion Quarterly 76. https://pcl.sites.stanford.edu/sites/g/files/sbiybj22066/files/media/file/iyengar-poq-affect-not-ideology.pdf
“Who Is Favored To Win The 2024 Presidential Election?” (2024, September 8). FiveThirtyEight. https://projects.fivethirtyeight.com/2024-election-forecast/