Voters & “The Economy”
The idea that economic conditions can make or break incumbent campaigns is well-embedded popular wisdom by now. But it is not clear what “the economy” means to voters: which metrics they care about and which crises they attribute to the White House.
Building on Achen and Bartels’ argument that retrospective voters have a recency bias in favor of recent economic conditions, this week I examine three short-term economic measures as candidates to approximate “the economy”: GDP growth, unemployment, and CPI.
Gross Domestic Product (GDP) Growth
Figure I (below) summarizes the relationship between GDP growth in the second quarter of an election year and the share of the two-party vote received by the incumbent party in that election. As is, the relationship is obscured by the presence of two outliers: 2020 and 1980.
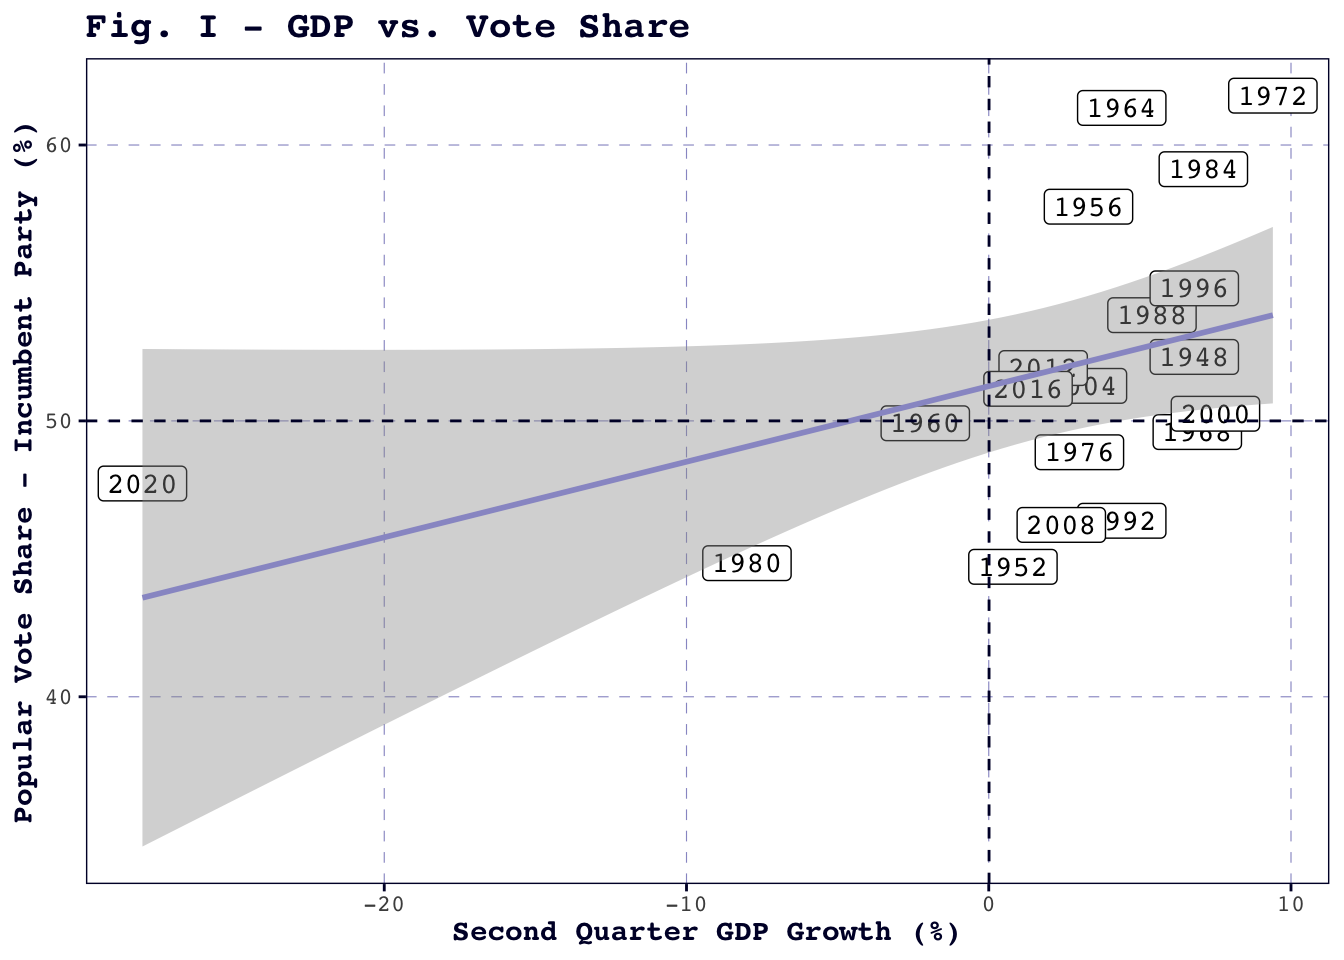
While 2020 has an incumbent vote share that is consistent with other election years, its extreme drop in Q2 GDP – negative 28% – due to the productivity stall caused by the COVID-19 pandemic dramatically flattens out the slope of the regression line. 1980 may seem tame by comparison, but it still registers a substantial decline in Q2 GDP, a symptom of the late-1970s recession which tanked Jimmy Carter’s reelection bid. It is not ideal to lose two points in a dataset as limited as this, with elections only going back as far as 1948, but since both 1980 and 2020 fall more than 1.5 times the Interquartile Range beneath the first quartile, satisfying a common threshold for outliers, they are excluded from Figure II (below).
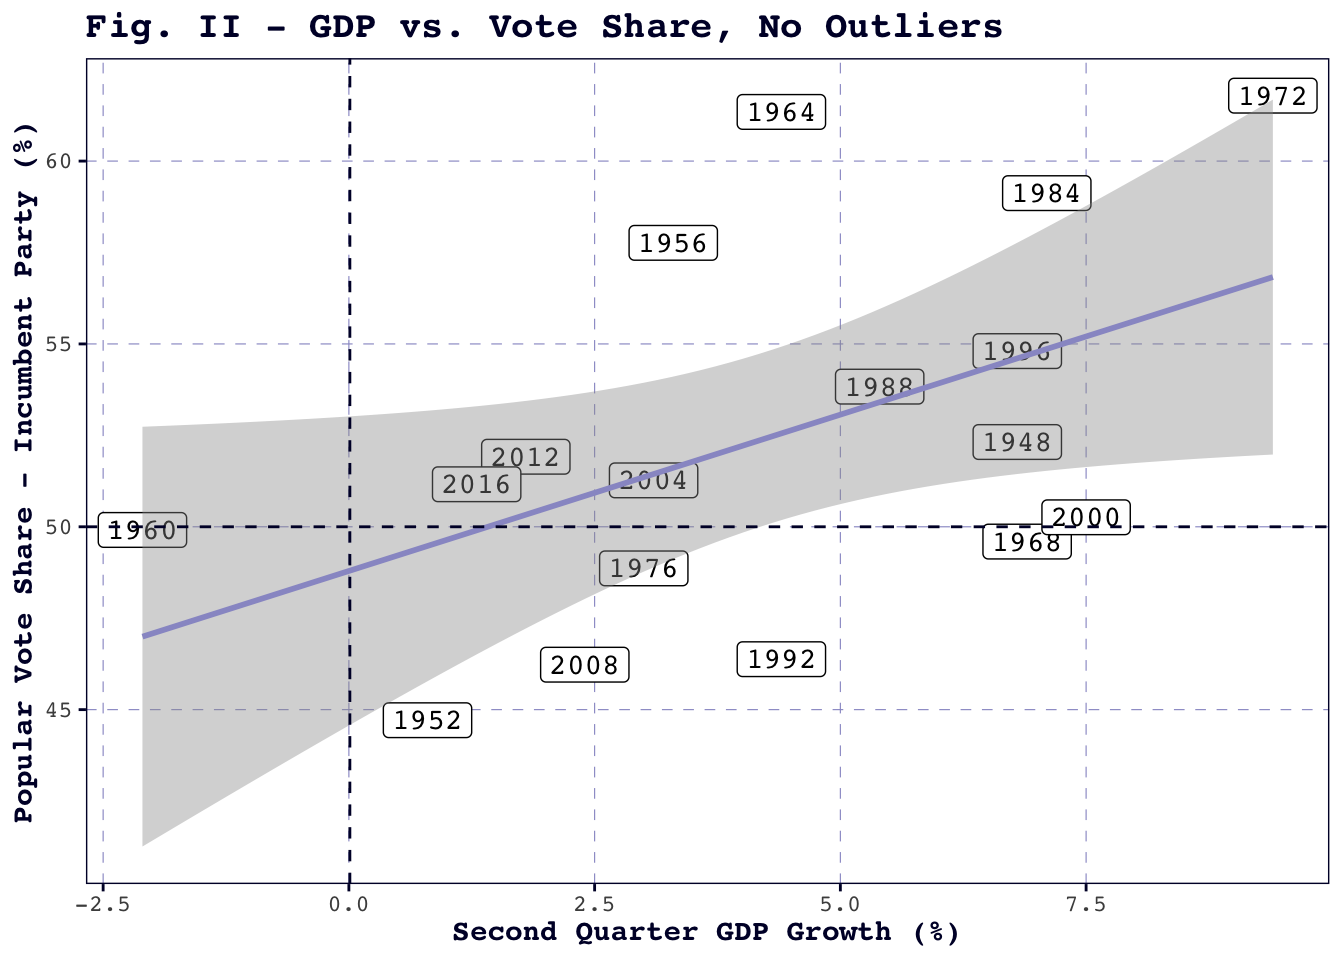
With the two outliers removed, the amount of variability in incumbent two-party vote share which can be explained by Q2 GDP growth jumps from about 0.19 to about 0.25. The model suggests that every one-point increase in Q2 GDP growth is associated with an expected increase of nearly 0.86%. Furthermore, unlike the outlier-inclusive model in Figure I, this relationship is found to be significant at a 95% confidence level, meaning we can be 95% confident that the observed 0.86 coefficient did not result from chance alone.
Unemployment
GDP growth appears to have a positive relationship with incumbent vote share, but is it really the best metric? Surely voters – if they really are myopic and self-interested – are more reactive to major life events like unemployment than to slippery abstractions like “national economic performance.”
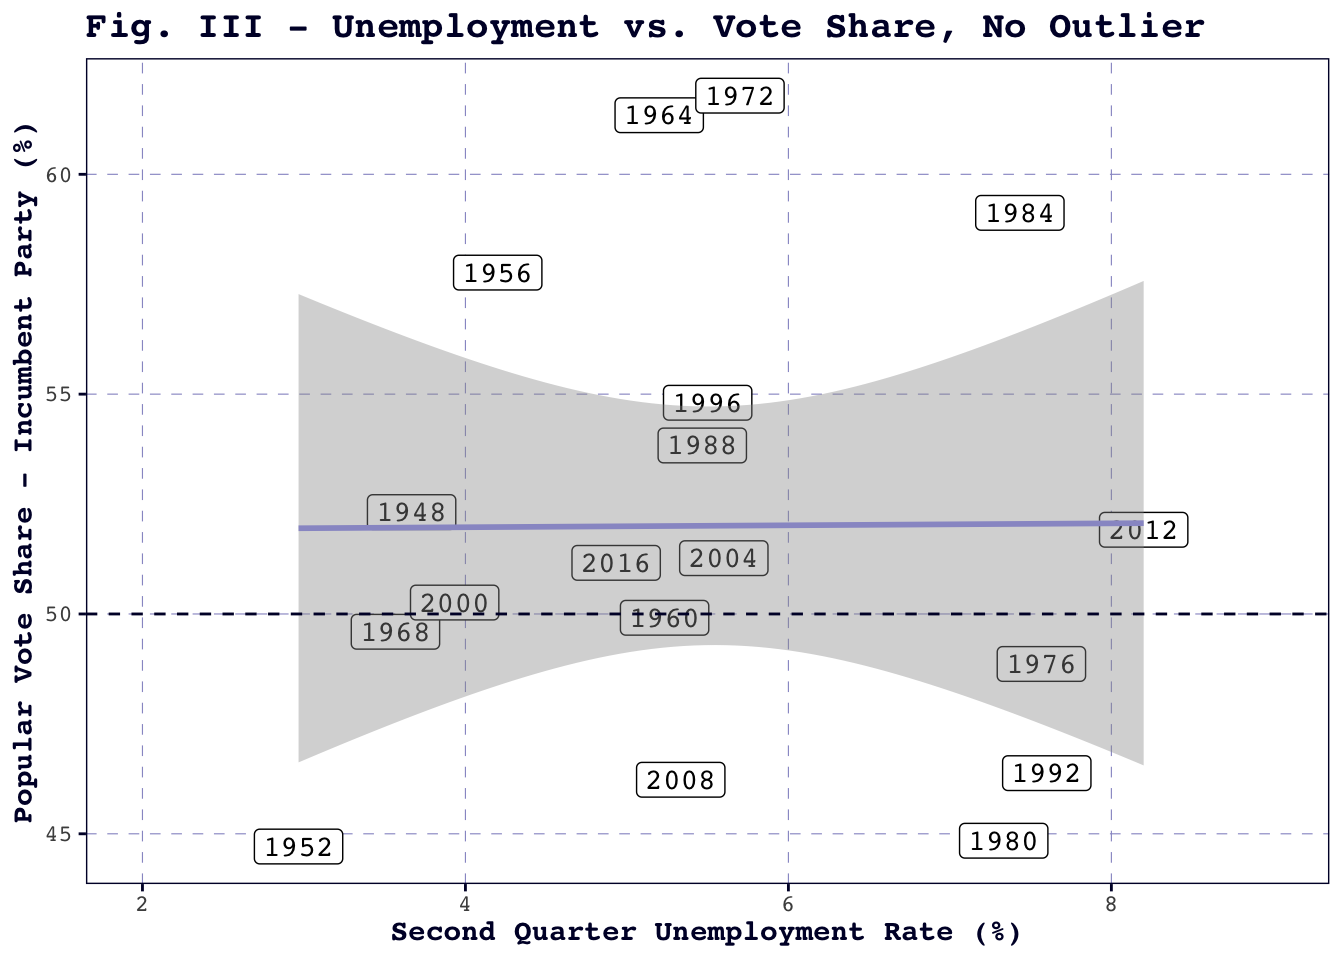
Figure III (below) challenges these common-sense expectations of voter behavior. There is no clear pattern in the distribution of election years, and the slope of the regression line approximates zero. Unsurprisingly, given this lack of visual consensus, the relationship between Q2 unemployment and incumbent vote share is not significant at the 95% confidence level. Note that 2020 is again an outlier in unemployment due to the pandemic, and is excluded in Figure III.
Consumer Price Index (CPI)
Perhaps voters dismiss fluctuations in unemployment as individual-level failures, but what about prices? Inflation has so dominated the national conversation in recent years that it seems plausible that voters’ grocery aisle frustrations could sink incumbents’ chances.
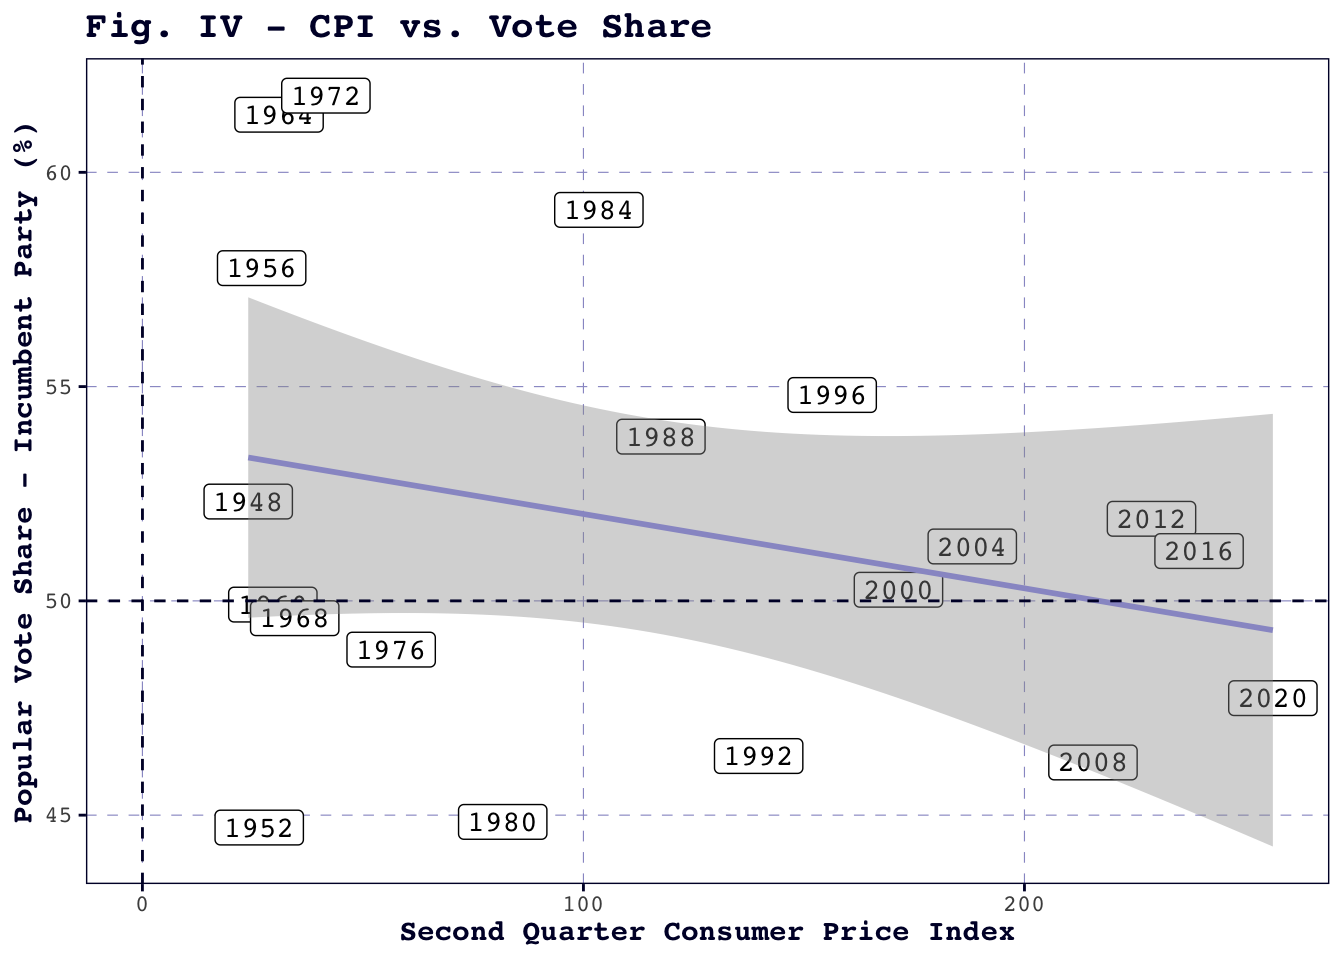
Figure IV (below) casts this hypothesis into doubt. Though the graph does model the expected negative relationship between the Consumer Price Index – a measure of the cost of a typical bundle of consumer goods – and incumbent vote share, the slope coefficient is not significant, and Q2 CPI accounts for a mere 0.08% of the total variability in incumbent vote share. However, it bears mentioning that more recent election years, including the often-irregular 2020 contest, hew closer to the regression line than do previous years. This could imply that prices are becoming a stronger predictor of voter behavior.
Multiple Regression
Combining all three predictors into one regression model does mechanically increase the R2, which seems to suggest that the model explains more of the variability in incumbent vote share. However, given the high probability of multicollinearity between these economic indicators, the multiple regression model comes at a high risk of overfitting, which is counterproductive since my goal is to predict 2024, an out-of-sample election. Moreover, since this model set-up should overinflate the apparent predictive power of the explanatory variables, it is telling that GDP growth remains the lone significant coefficient.
Models in Review
The predictions made by each of the models can be seen in the table below. Note that the point estimate is for the incumbent’s (in this case, Harris’s) two-party vote share. While the point estimates are generally clustered around 50, with only the multiple regression dipping slightly lower than the rest, the lower and upper bounds point to a large amount of uncertainty in all of the models. Since all four predicted intervals cross the 50% mark, none are able to predict a winner at the 95% confidence level.
| Model | Prediction | Lower Bound | Upper Bound |
|---|---|---|---|
| GDP Growth | 51.36 | 41.26 | 61.46 |
| Unemployment | 51.97 | 39.83 | 64.11 |
| CPI | 48.33 | 35.59 | 61.07 |
| Multiple | 46.30 | 33.25 | 59.36 |
I selected the Q2 GDP growth model, since it has a significant coefficient but is less prone to overfitting than the multiple regression. After running a cross-validation procedure to test the model’s out-of-sample predictive power, I found that the out-of-sample residuals were normally distributed with an average absolute value of about 2.01. Since the incumbent two-party popular vote shares captured in the dataset range from about 44.71 to 61.79, this seems like a reasonable error, though it may compromise the model’s ability to predict a definite winner.
This model implies that voters are not so shortsighted as to focus just on their immediate economic realities, from grocery prices to layoffs. Instead, they are significantly swayed by national conditions. Perhaps the GDP-influenced voter reacts to alarmed news reports or worries about America’s status as a world power in times of lowered input.
A Note on Incumbency
Will the GDP model’s already-uncertain prediction that Democrats will win 51.36% of the popular vote hold up with an “incumbent” like Harris, who has not been president herself?
Figure V (below) appears to show that incumbent presidents (shown in teal) experience a steeper positive slope in the GDP model, whereas for incumbent-party candidates (in orange) the relationship is more muted.
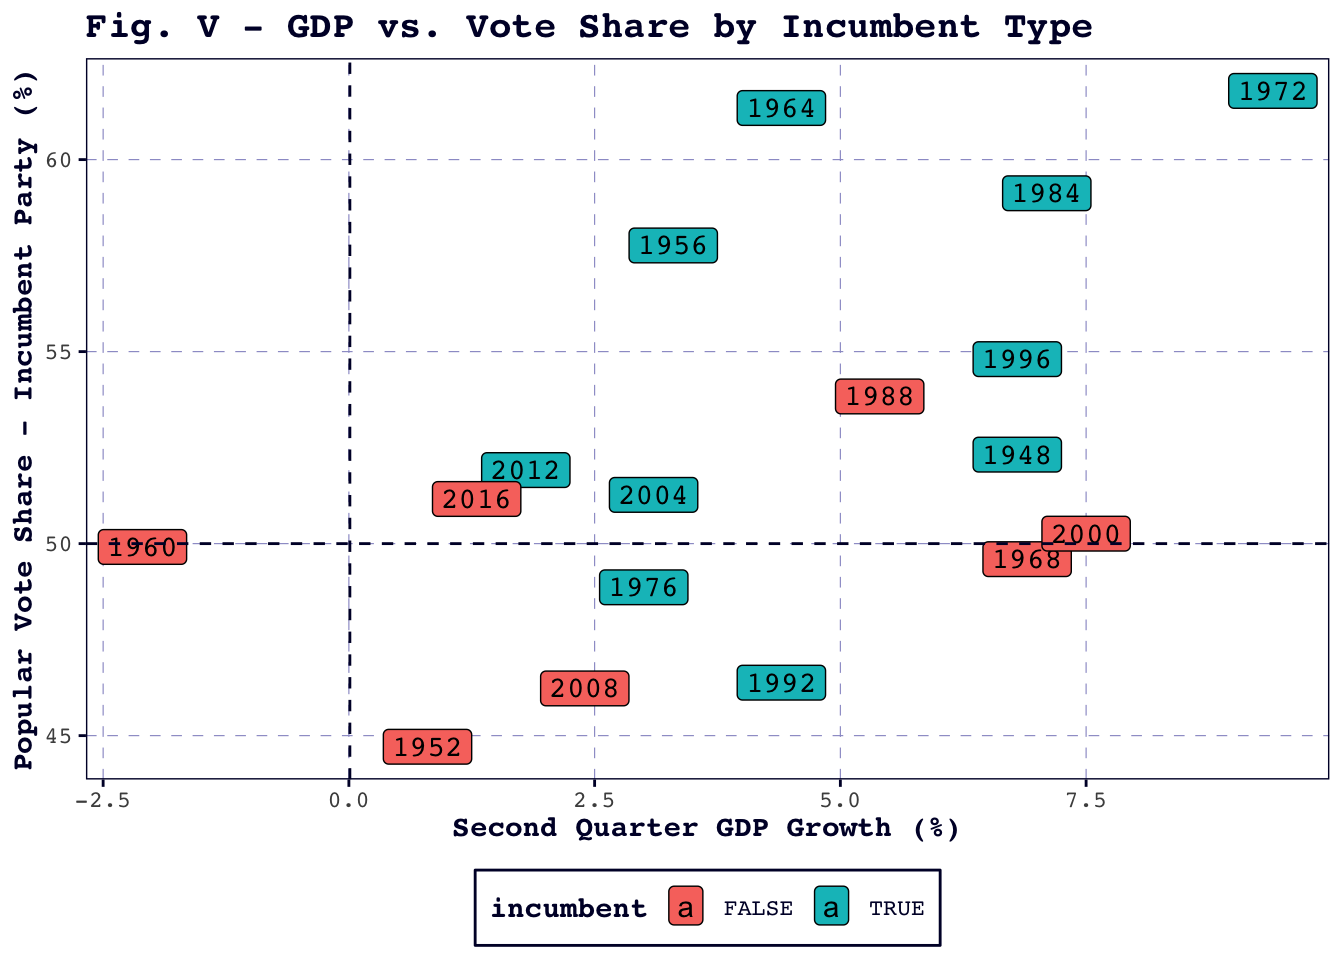
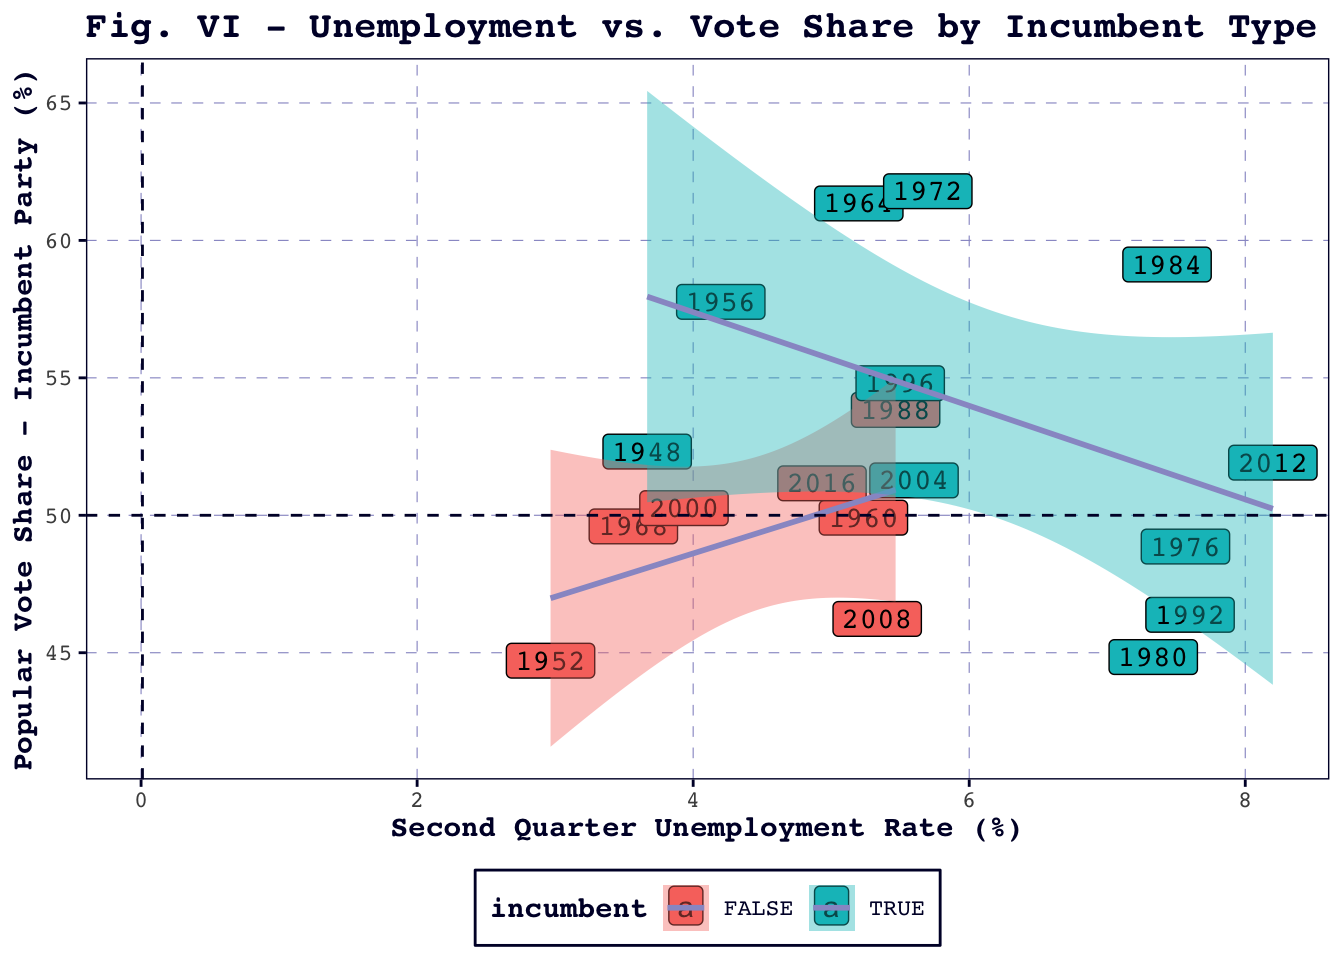
Admittedly, the data points are few and far between. Figure VI (below), which models a startling positive correlation between unemployment and incumbent-party candidates’ vote share, illustrates the danger of working with such limited data.
Rather than restrict this already limited dataset even further, my model assumes that Kamala Harris, as the sitting Vice President, will act similarly to a straightforward incumbent.
References
Christopher H Achen and Larry M Bartels. Democracy for realists: Why elections do not produce responsive government. Princeton University Press, 2017. https://hollis.harvard.edu/primo-explore/fulldisplay?docid=01HVD_ALMA512397392810003941&vid=HVD2&search_scope=everything&tab=everything&lang=en_US&context=L